GUTSCHEIN
Bitte haben Sie einen Moment Geduld, wir legen Ihr Produkt in den Warenkorb.
Diese Produkte könnten Sie auch interessieren:
Bitte haben Sie einen Moment Geduld, wir legen Ihr Produkt in den Warenkorb.
| Themen | Informatik und Informationstechnologie Computerprogrammierung und Softwareentwicklung Programmier- und Skriptsprachen, allgemein |
|---|---|
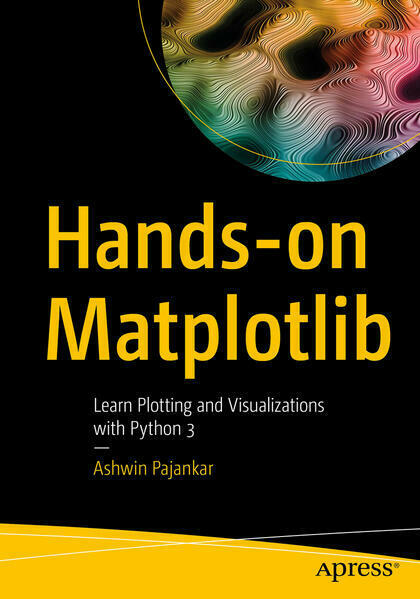
| ISBN | 9781484274095 |
| Sprache | Englisch |
| Erscheinungsdatum | 28.11.2021 |
| Größe | 25.4 x 17.8 cm |
| Verlag | APRESS |
| Lieferzeit | Lieferung in 7-14 Werktagen |
| Herstellerangaben | Anzeigen Springer Nature Customer Service Center GmbH Europaplatz 3 | DE-69115 Heidelberg ProductSafety@springernature.com |
Learn the core aspects of NumPy, Matplotlib, and Pandas, and use them to write programs with Python 3. This book focuses heavily on various data visualization techniques and will help you acquire expert-level knowledge of working with Matplotlib, a MATLAB-style plotting library for Python programming language that provides an object-oriented API for embedding plots into applications. You'll begin with an introduction to Python 3 and the scientific Python ecosystem. Next, you'll explore NumPy and ndarray data structures, creation routines, and data visualization. You'll examine useful concepts related to style sheets, legends, and layouts, followed by line, bar, and scatter plots. Chapters then cover recipes of histograms, contours, streamplots, and heatmaps, and how to visualize images and audio with pie and polar charts. Moving forward, you'll learn how to visualize with pcolor, pcolormesh, and colorbar, and how to visualize in 3D in Matplotlib, create simple animations, and embed Matplotlib with different frameworks. The concluding chapters cover how to visualize data with Pandas and Matplotlib, Seaborn, and how to work with the real-life data and visualize it. After reading Hands-on Matplotlib you'll be proficient with Matplotlib and able to comfortably work with ndarrays in NumPy and data frames in Pandas. What You'll Learn
| Themen | Informatik und Informationstechnologie Computerprogrammierung und Softwareentwicklung Programmier- und Skriptsprachen, allgemein |
|---|---|
| ISBN | 9781484274095 |
| Sprache | Englisch |
| Erscheinungsdatum | 28.11.2021 |
| Größe | 25.4 x 17.8 cm |
| Verlag | APRESS |
| Lieferzeit | Lieferung in 7-14 Werktagen |
| Herstellerangaben | Anzeigen Springer Nature Customer Service Center GmbH Europaplatz 3 | DE-69115 Heidelberg ProductSafety@springernature.com |
Wie gefällt Ihnen unser Shop?